Portfolio
Tone House
Thirteen dashboards. One date range. Every question about the studio.

Reporting since2021, refreshed nightly from Mindbody with no manual steps
What it answersAttendance, capacity, schedule, instructors, intro conversion, revenue and client activity
Behind itTableau on a Virtual Window-managed server and database, plus the custom website-to-Mindbody purchase flow
Industry: Boutique Fitness
Services: Data Integration | Business Intelligence | Purchase-Flow Integration
Key Takeaway: Booking software records what happened. Reporting that rebuilds itself every night tells you what to do next.
Challenge
Tone House, a strength and conditioning studio in New York, runs classes, passes and purchases through Mindbody. Mindbody’s built-in reports answer one question at a time. Lining up capacity, schedule, instructors, intro-offer conversion and revenue meant exports and spreadsheets, and the picture was stale by the time anyone finished assembling it.
Our Solution
We built a reporting environment that pulls classes, attendance, passes, purchases and payments from Mindbody into a database we manage, refreshed every night with no manual steps, and modeled it for Tableau alongside the ad-platform data behind the new-athlete campaigns.
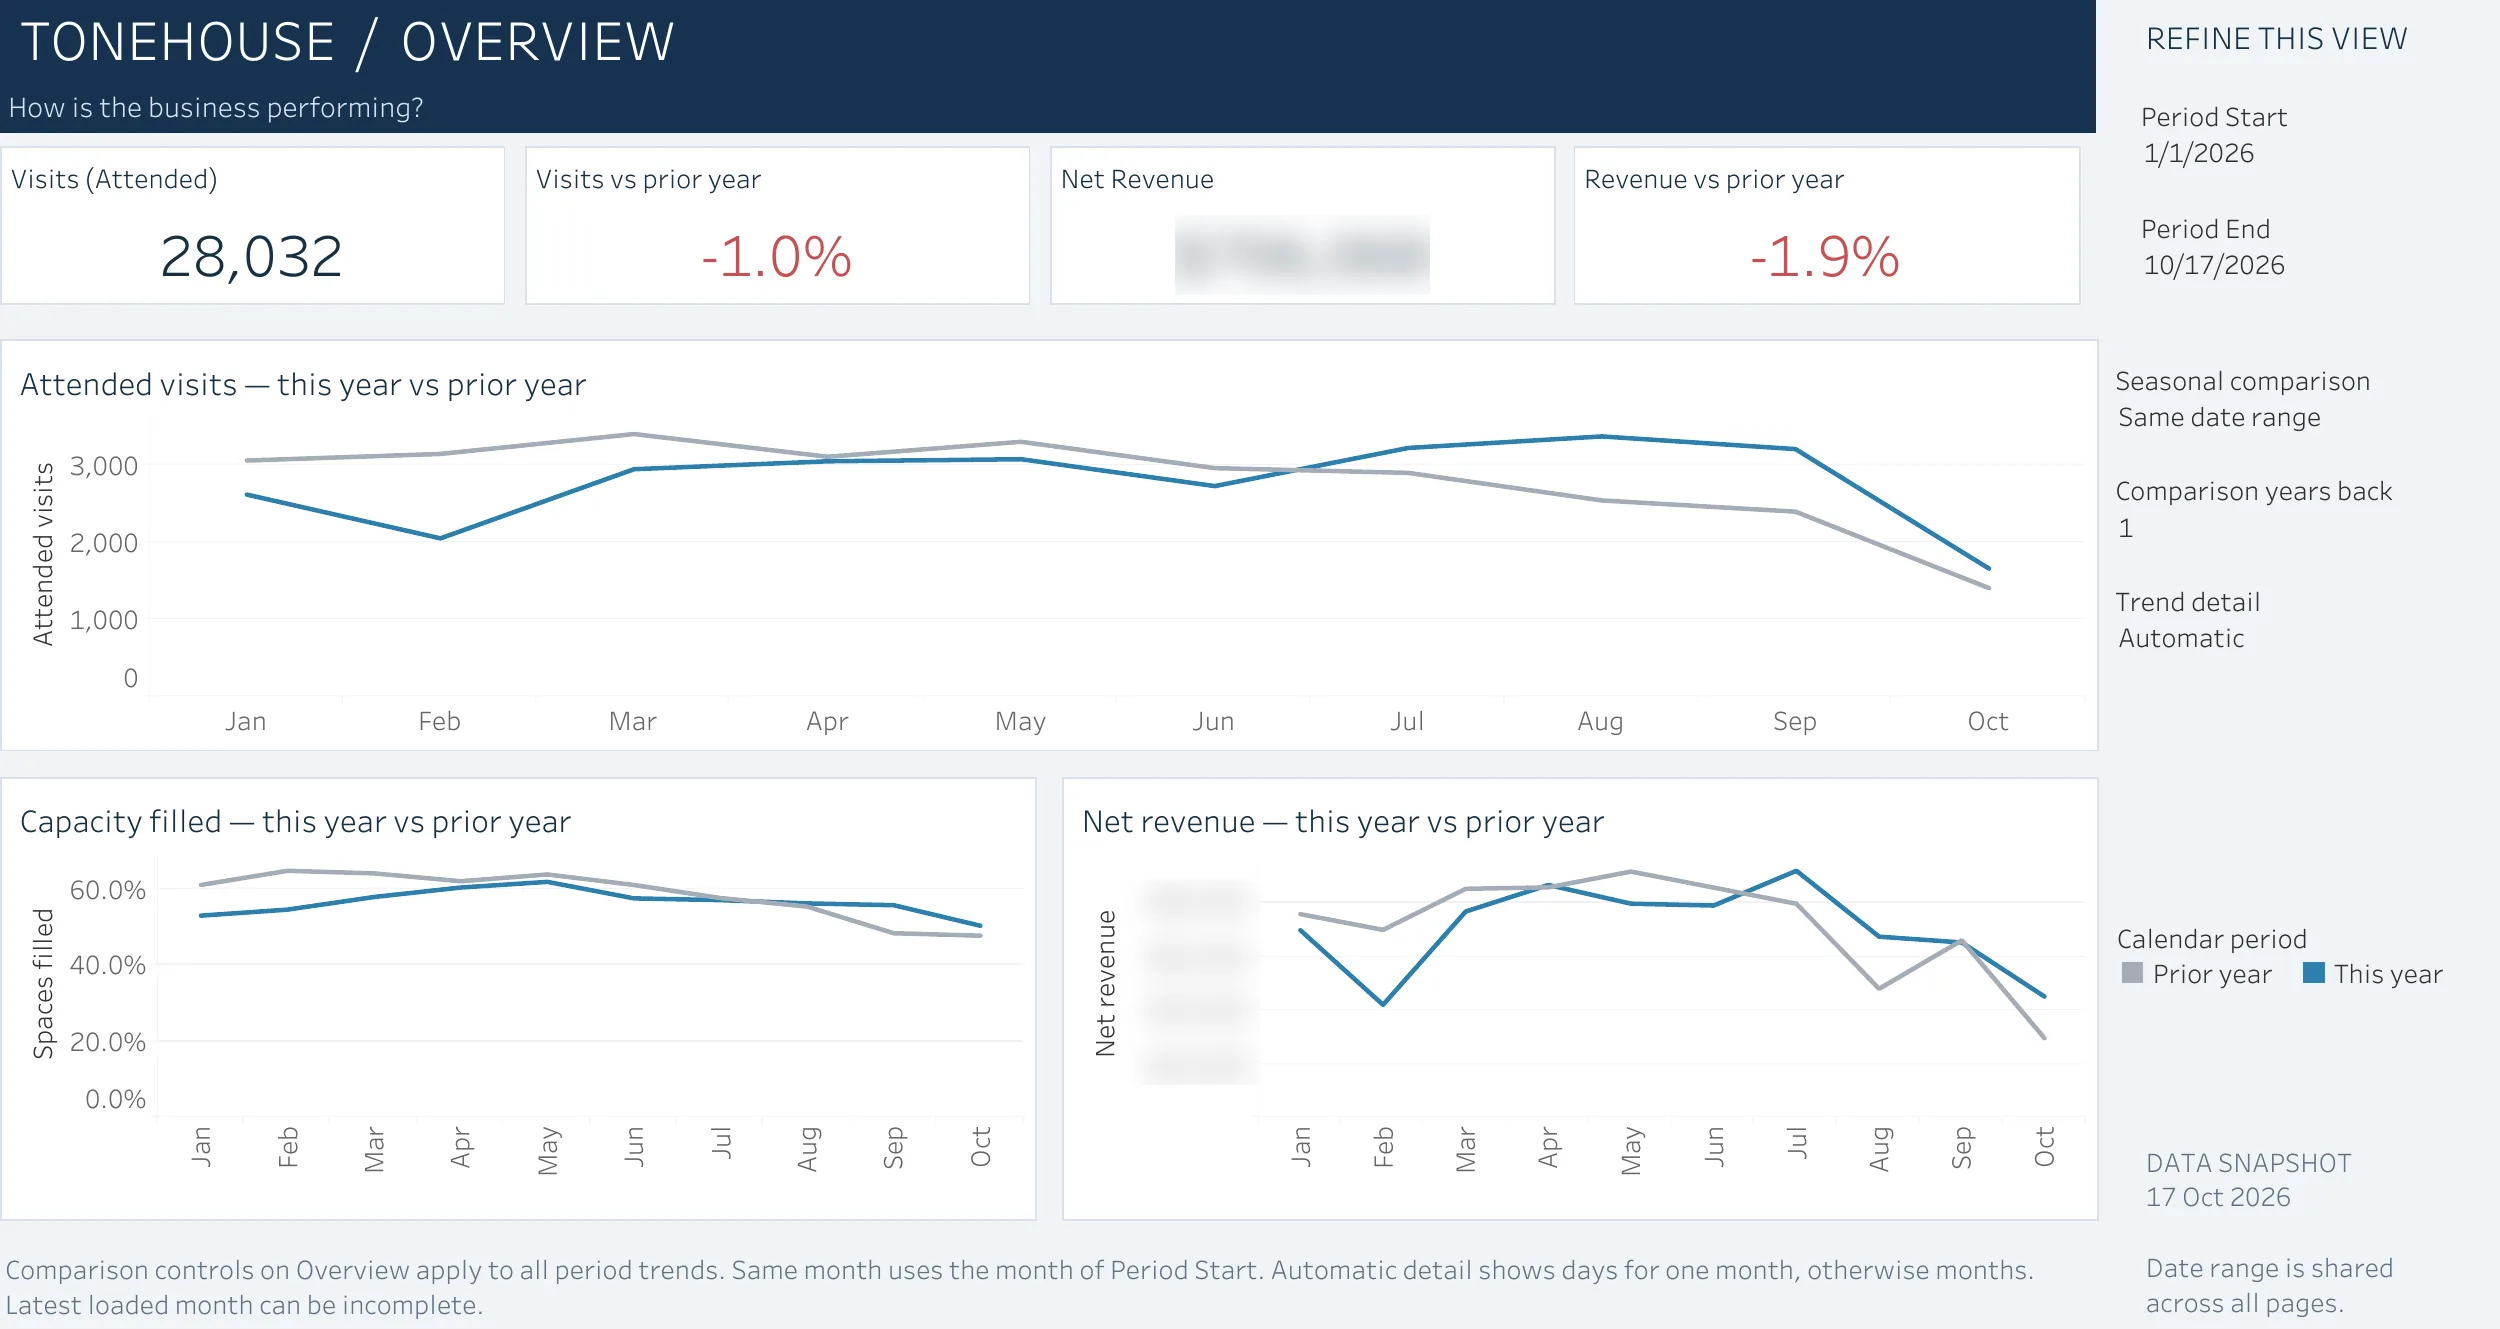
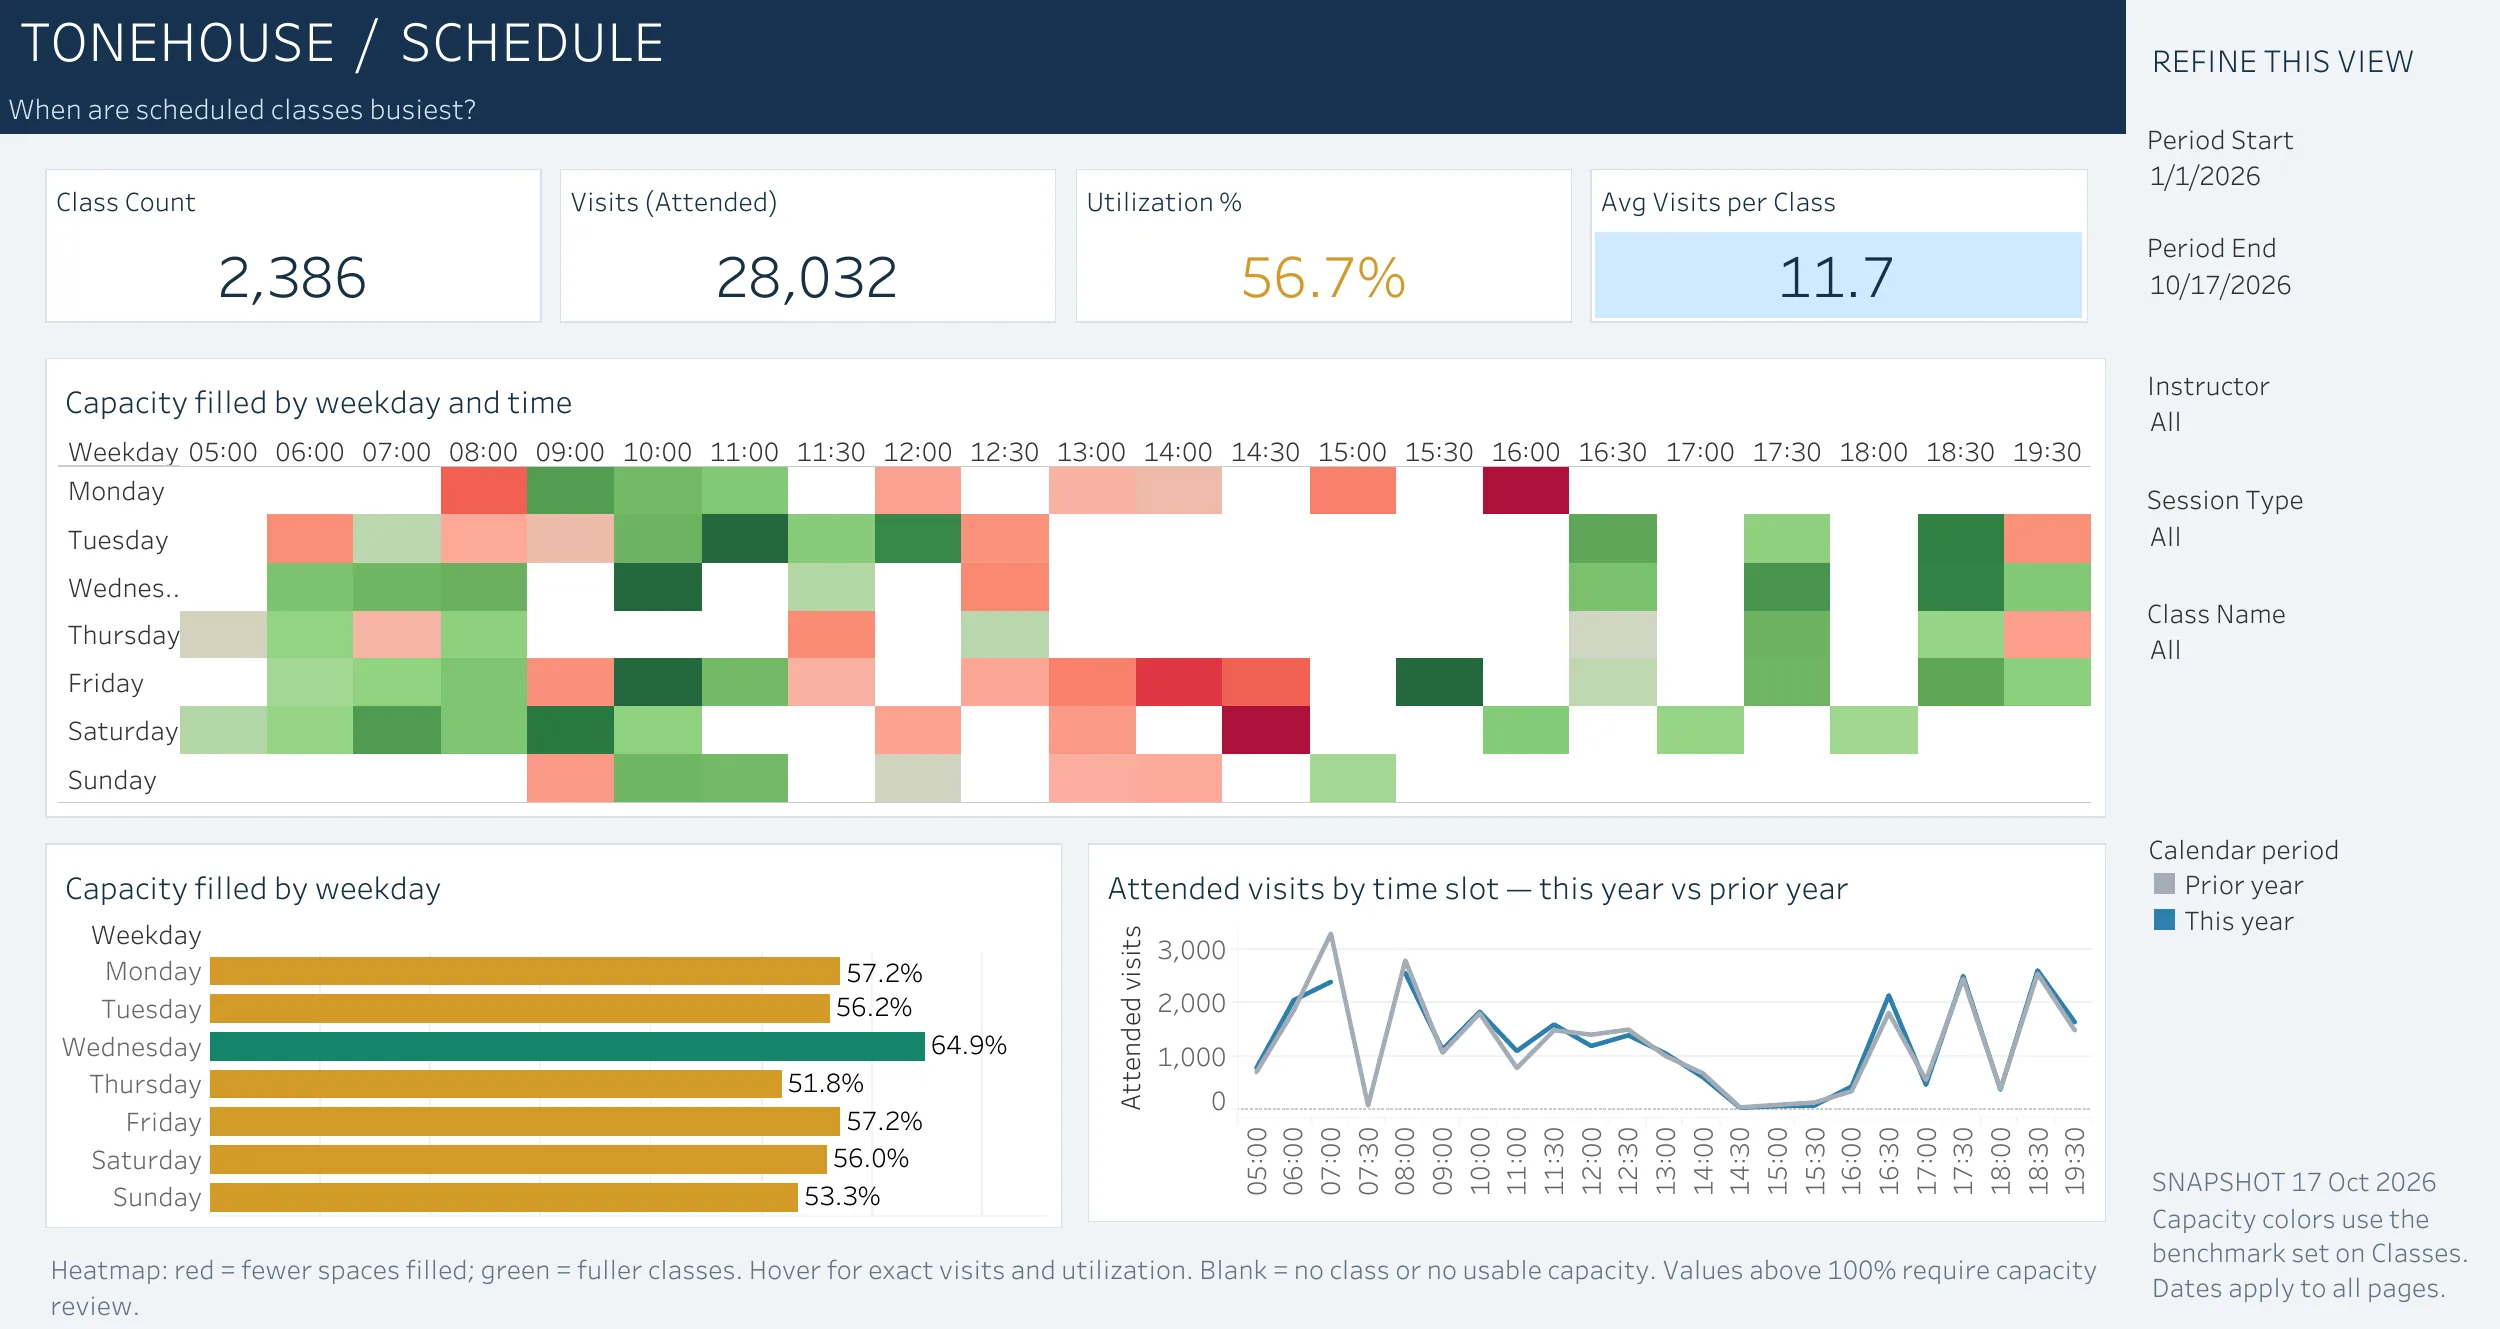
The Tableau workbook is organized around the questions staff actually ask. Thirteen pages share one date range: Overview, Classes, Schedule, Instructors, Attendance Losses, Intro Conversion, Capacity Forecast, Revenue, Products and Payments, Client Activity, Client Value and Class Detail. Capacity colors follow one adjustable benchmark. Attendance is classified from visit flags rather than the source status label, which we found unreliable. A six-month utilization forecast shows its own uncertainty band.
The data starts on the website. On the New Athlete page we replaced the stock Mindbody widget with a custom purchase flow connected directly to Mindbody, handling Rookie Pass, promo codes and eligibility rules, with a step-by-step data layer so the ad platforms get accurate conversions. Rookie Pass performance then flows into the dashboards and an automated daily email.
What we delivered
- Nightly automated Mindbody data pipeline into a managed database
- Tableau data model with ad-platform data alongside studio data
- 13-page Tableau workbook on one shared date range
- Six-month capacity and utilization forecast
- Custom New Athlete purchase flow connected directly to Mindbody
- Rookie Pass, promo code and eligibility handling
- Step-by-step data layer for accurate ad conversions
- Automated daily Rookie Pass performance email
- Ongoing expansion since 2021
Business Value
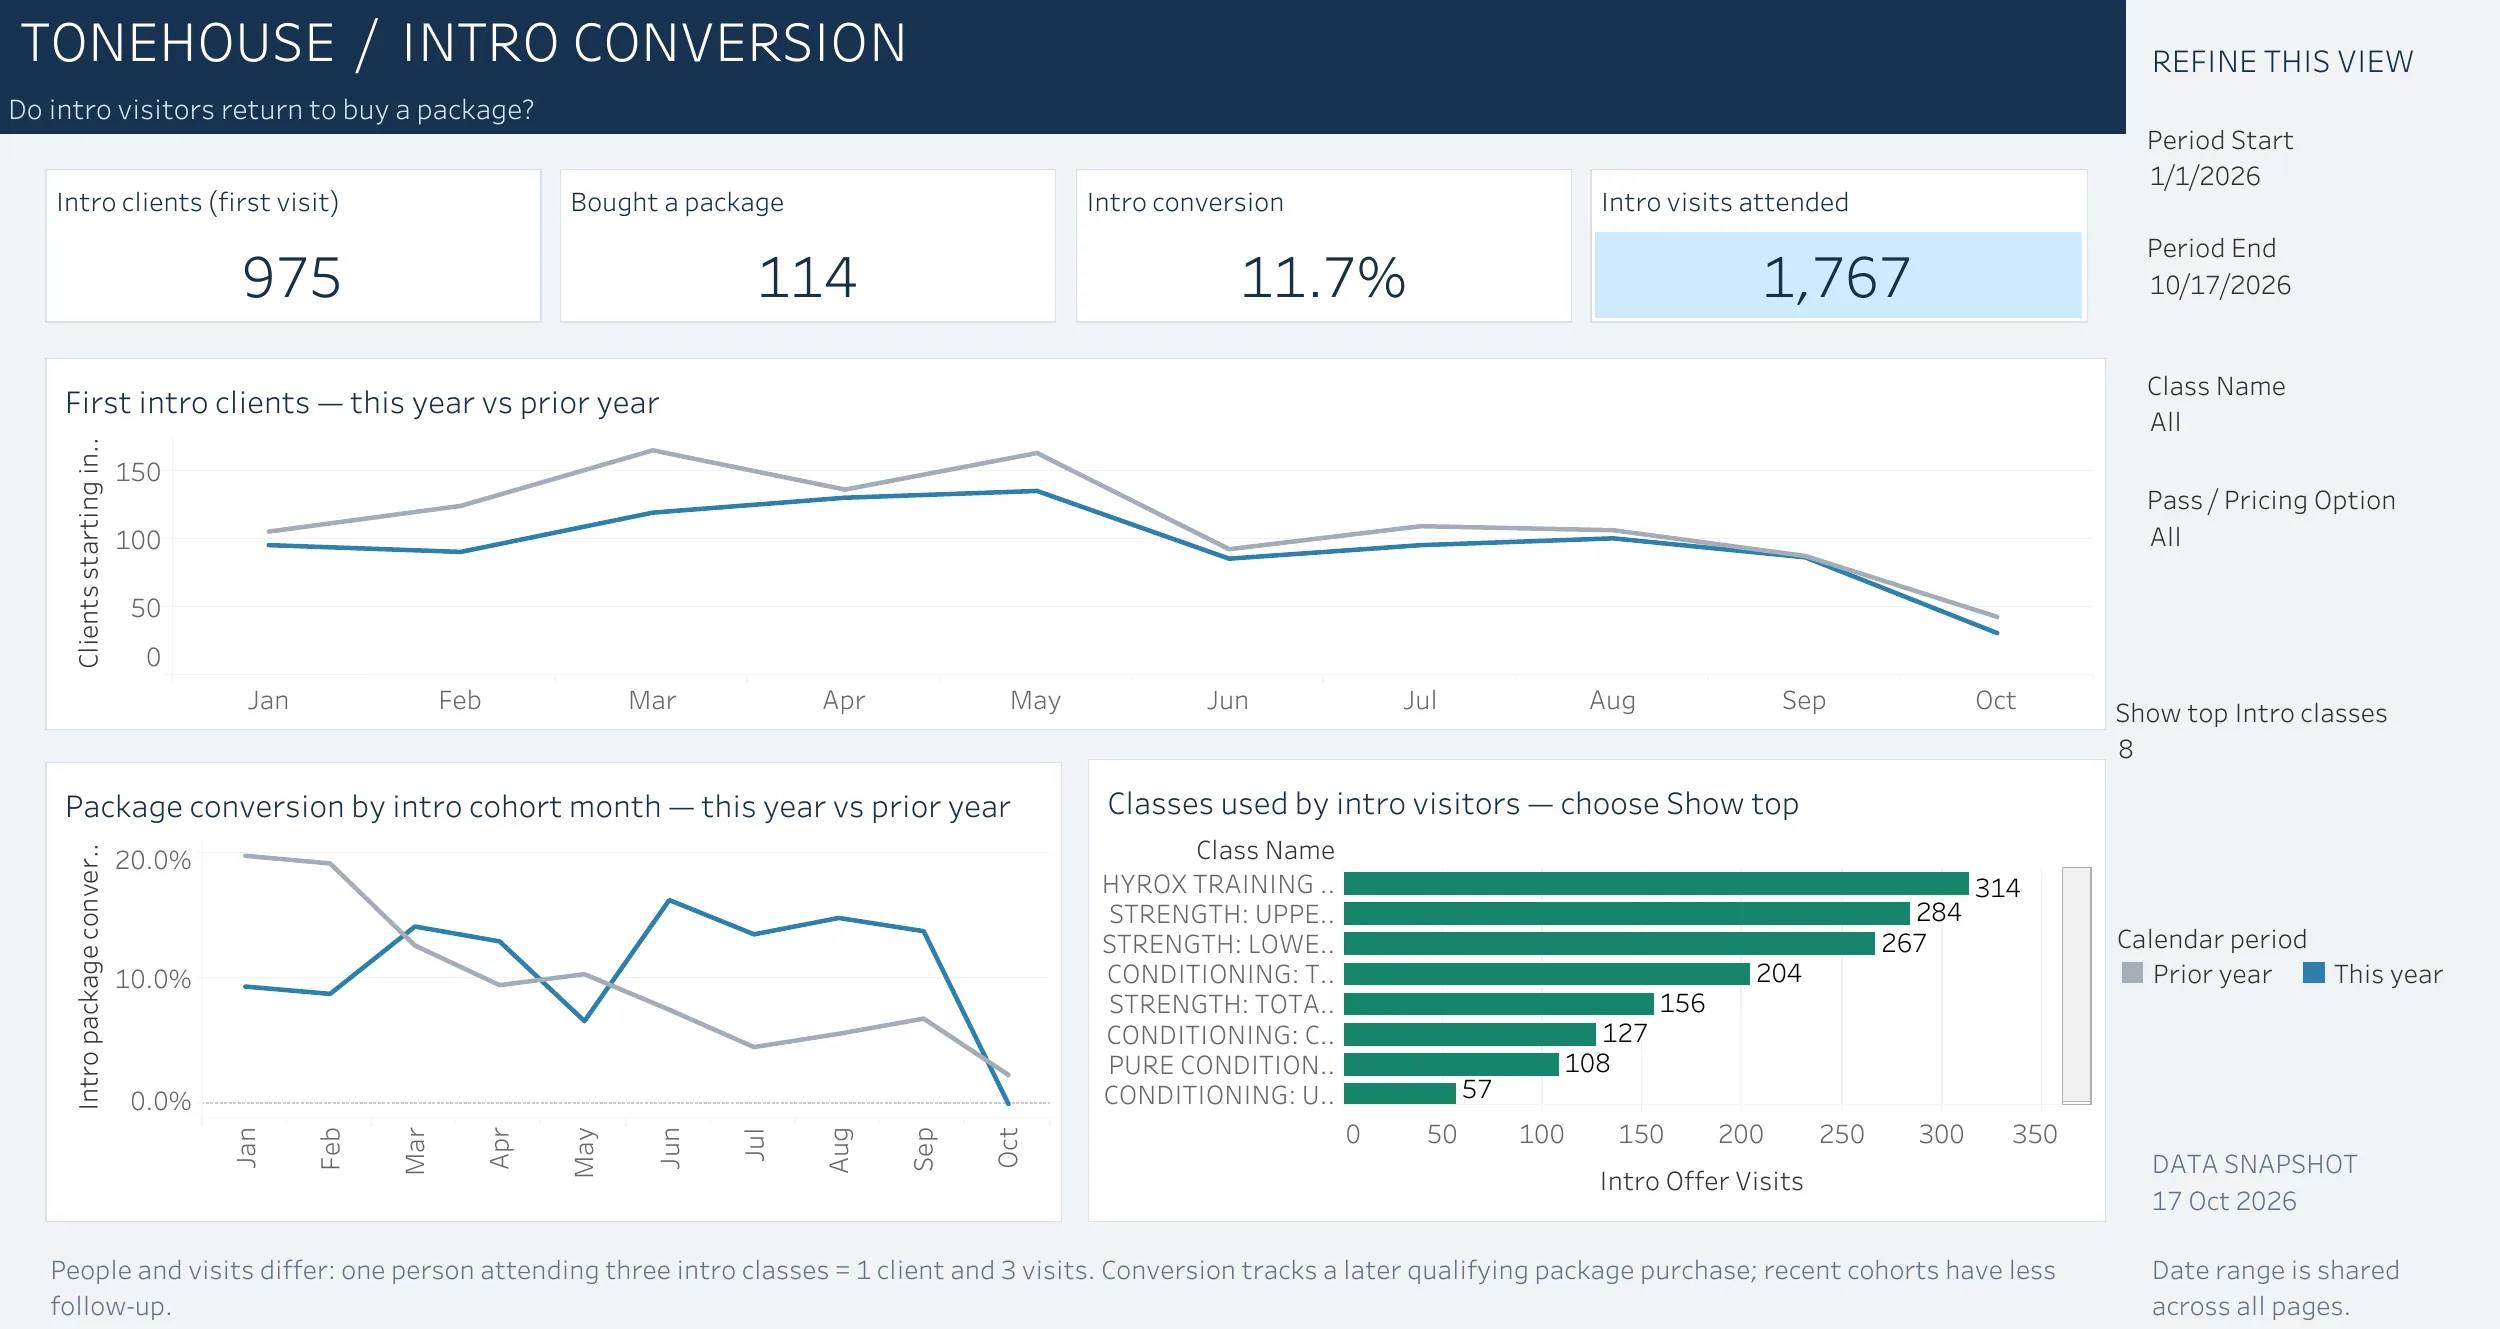
Staff pick a period once and get a consistent answer on every page: where capacity sits by weekday and hour, which classes draw late cancels and no-shows, whether intro athletes come back to buy a package, and how utilization is trending against last year.
Because the pipeline runs itself, the same foundation has kept absorbing new questions since 2021, instructor comparisons, forecasting, ad-platform comparisons, without another round of exports.
One date range, every question
Pick the period once and every page, from the overview to the single class, follows it.
OverviewClassesScheduleInstructorsAttendance lossesIntro conversionCapacity forecastRevenueProductsClient activity



Ready to Start the Conversation?
Every engagement begins with an introductory call. We’ll discuss your goals, answer your questions, and determine whether Virtual Window is the right fit.