Blog Post

Blog Post
Intelligence & Analytics
You Can’t Improve What You Can’t See
Every click. Every lead. Every conversion. Your business is generating more data than ever before. The challenge isn’t collecting it. It’s turning it into answers your team can actually use.












From Data to Insight
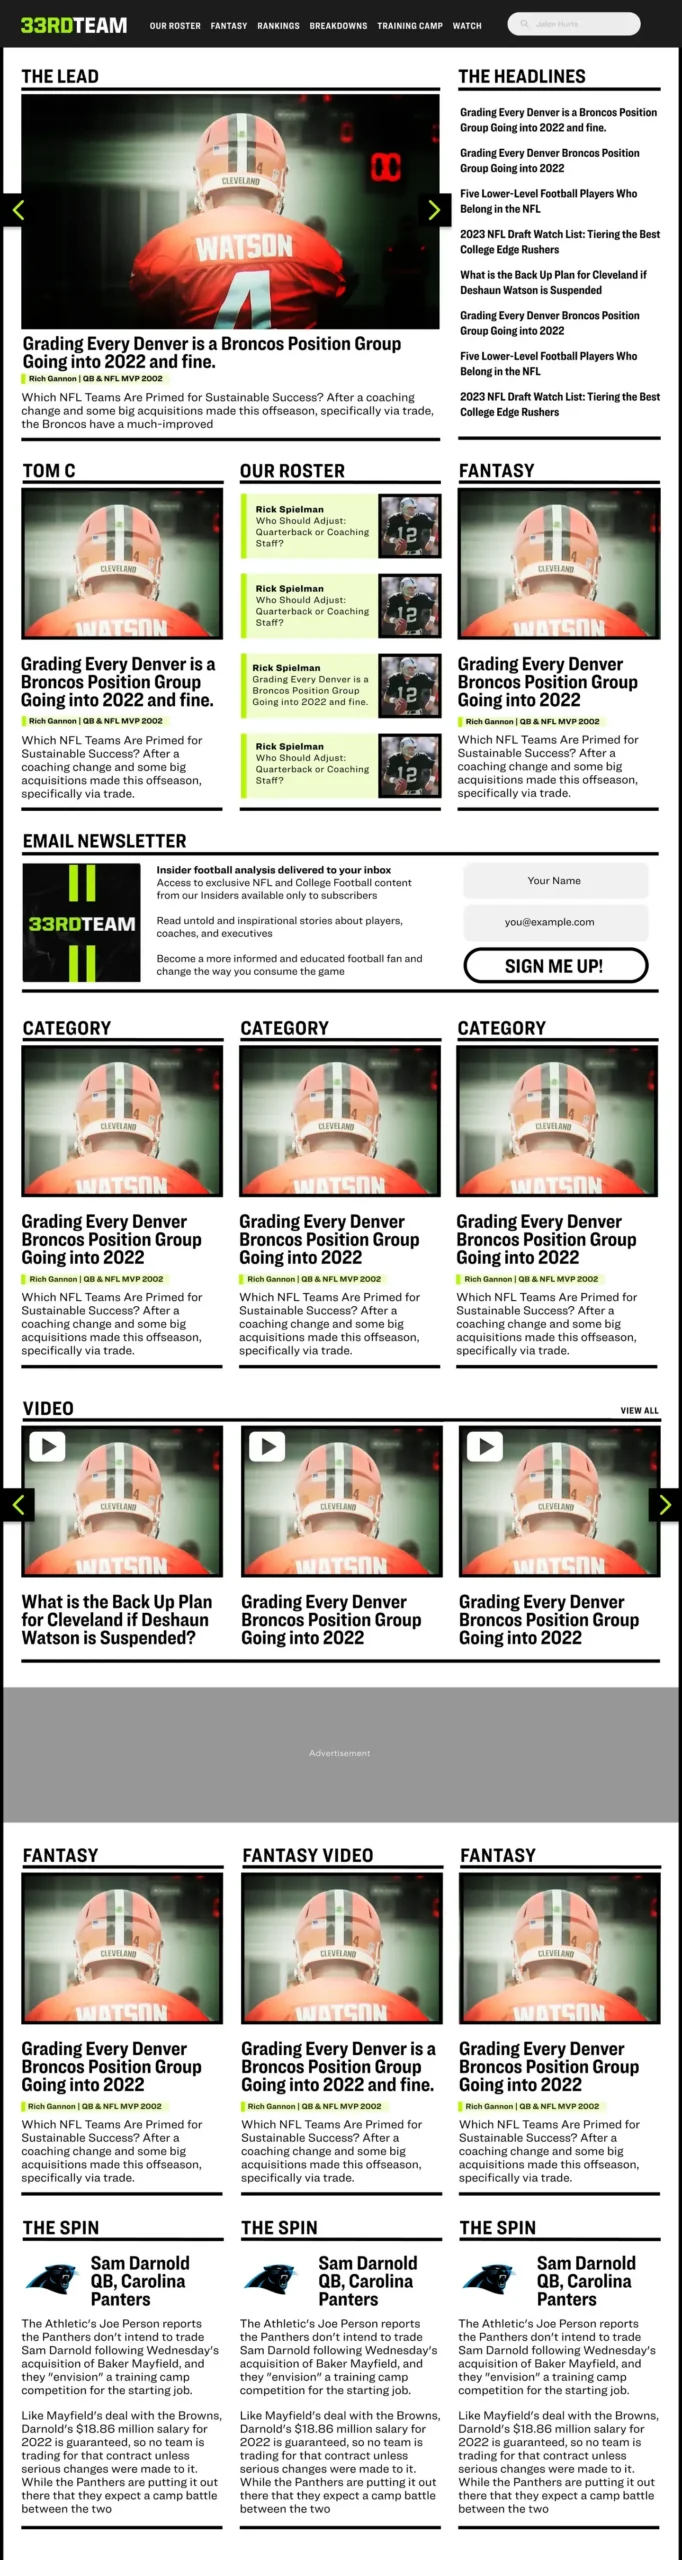
You’re not short on data. You’re short on answers you trust. We connect, organize, and visualize your data so every team works from the same numbers and makes decisions faster.
Unified Reporting
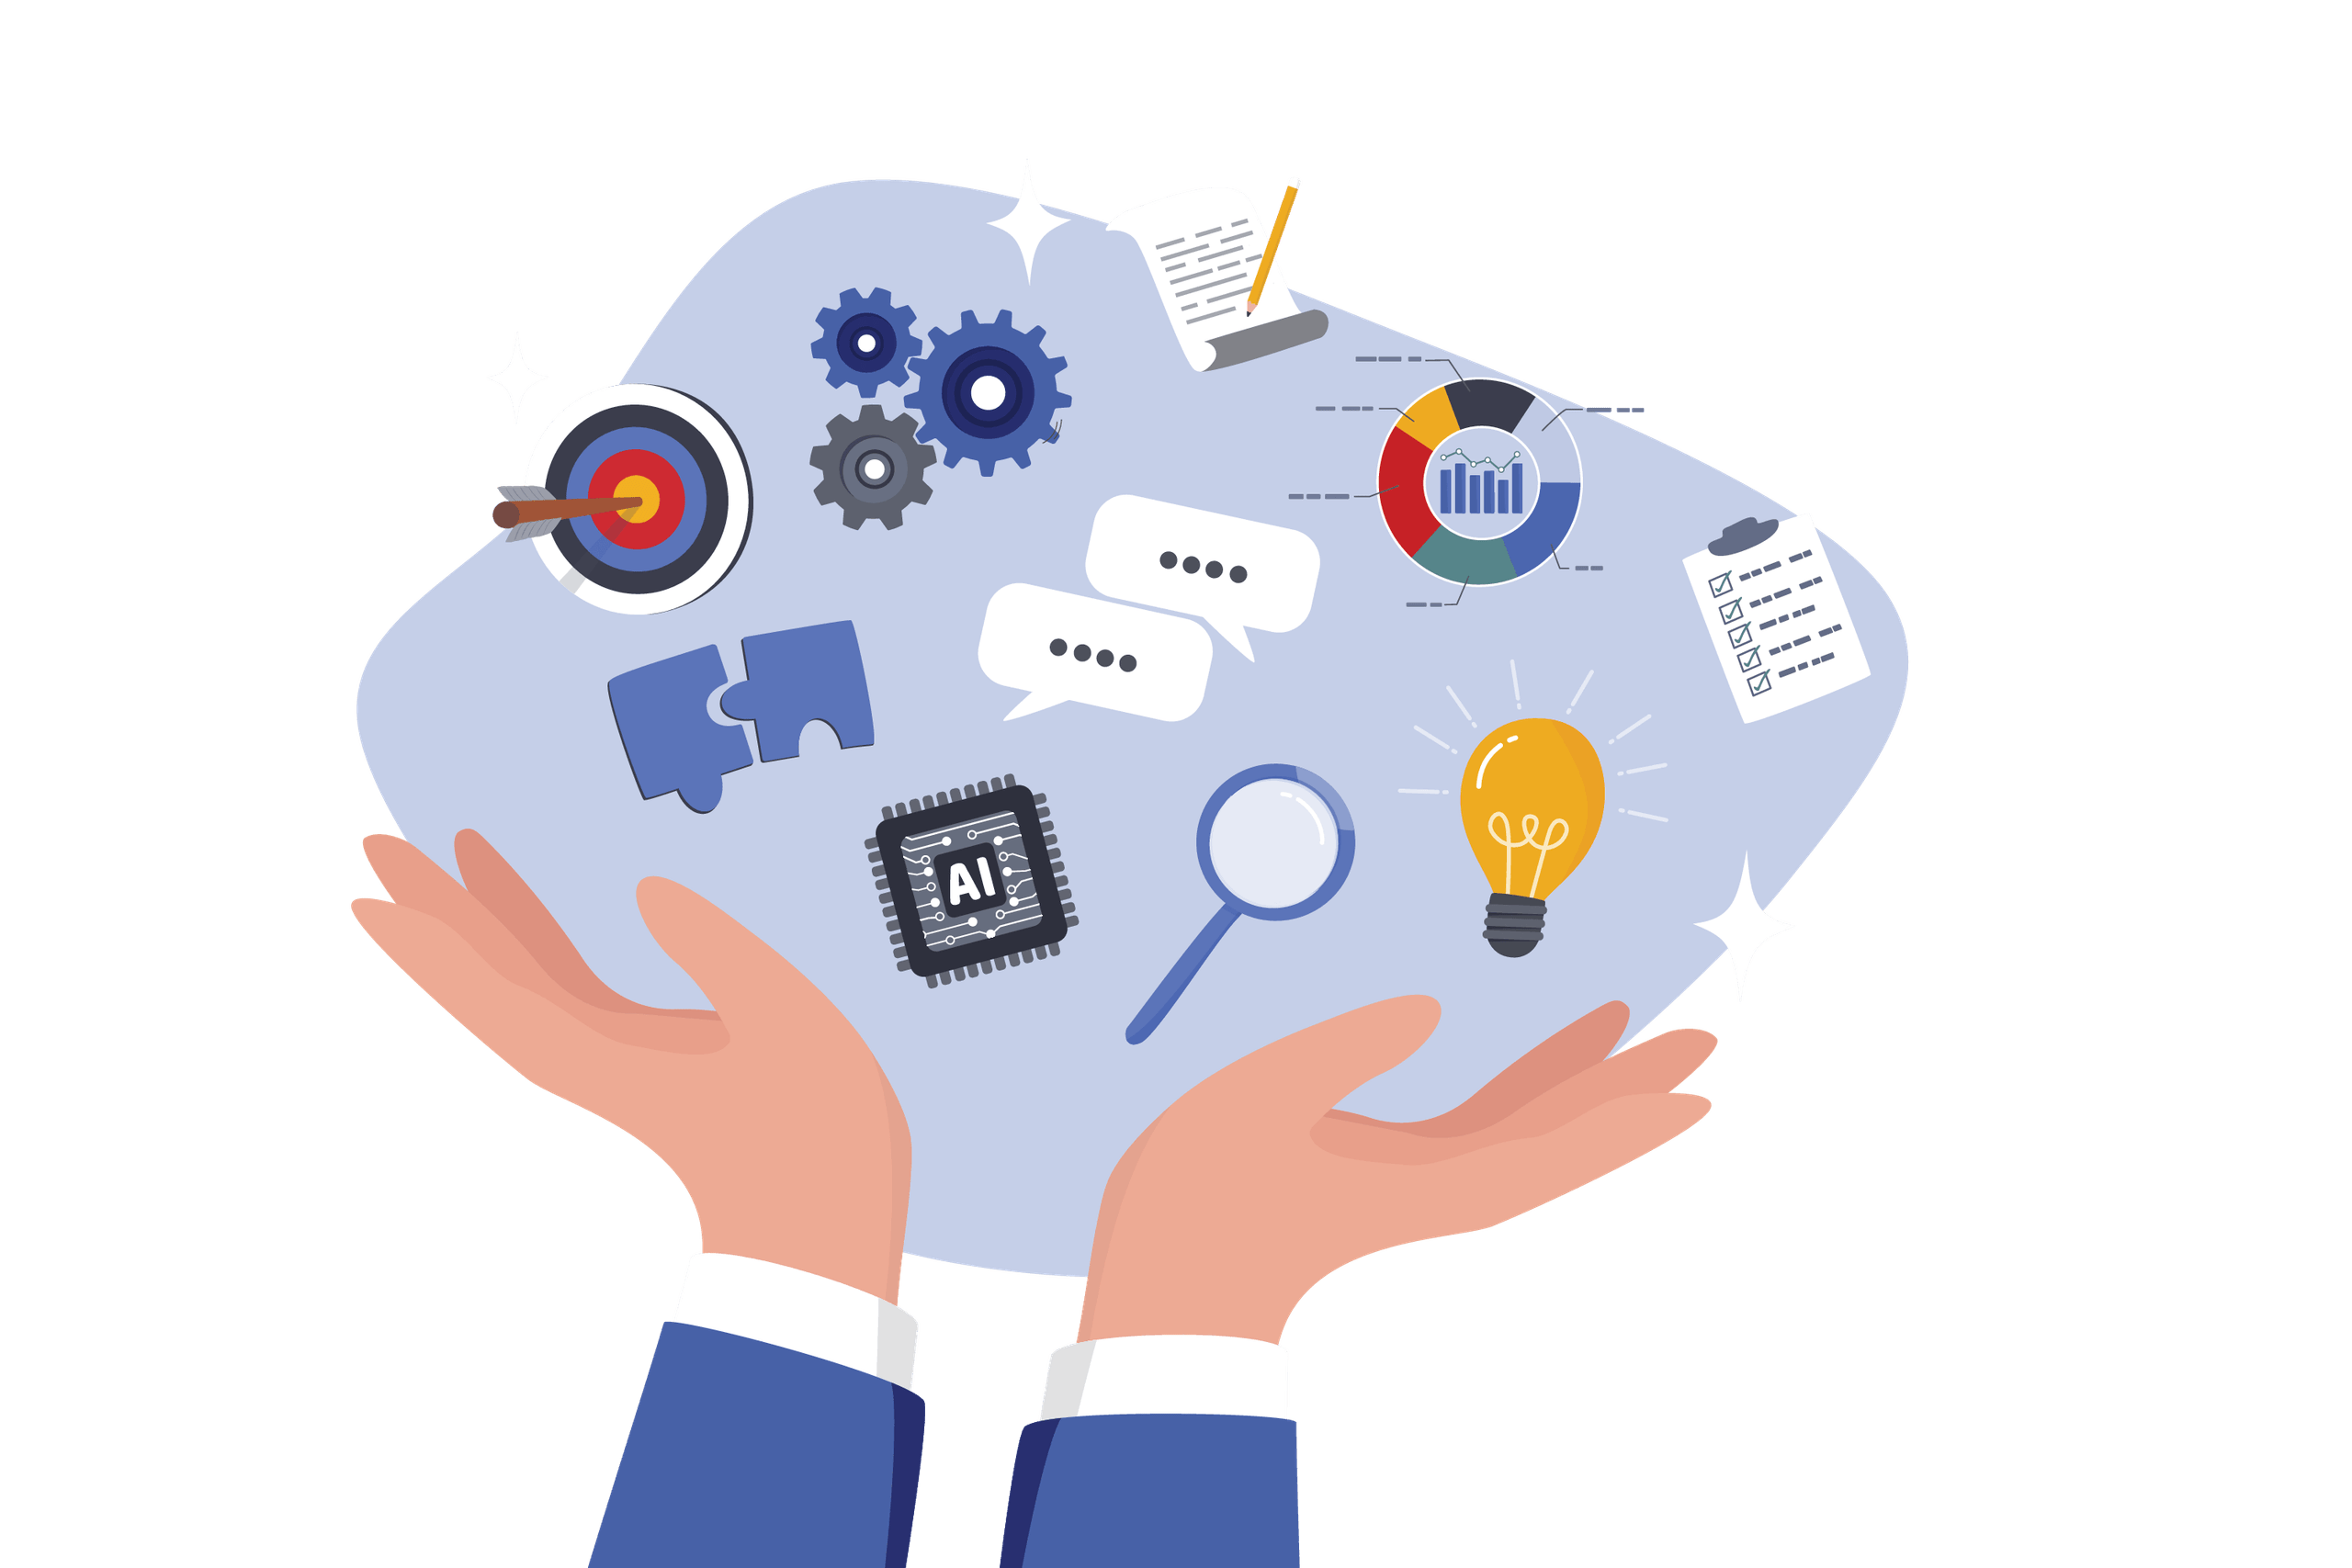
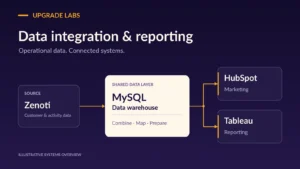
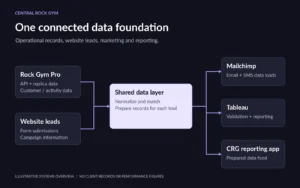
Bring data from multiple platforms into one consistent view. We connect your CRM, website, booking, and ad platforms into a single reporting layer with definitions everyone agrees on, so the same question gets the same answer every time.
Executive Dashboards
Surface the KPIs that matter most without manual reporting. Leadership sees what’s working and what needs attention at a glance, updated automatically, instead of waiting for someone to pull numbers into a spreadsheet.
Customer Intelligence
Understand how customers engage across every touchpoint. We track the path from first visit to lead to customer, so you can see where people drop off, what brings them back, and which experiences actually convert.
Attribution & Performance
Measure what’s driving leads, revenue, and long-term growth. We tie campaigns and channels to real outcomes, not just clicks, so you know where to invest more and what to stop funding.
Why Virtual Window?
One Story. Not Five Different Reports.
Marketing says one thing. Sales says another. Finance has a different number. When every platform tells a different story, the meeting turns into a debate about whose spreadsheet is right.
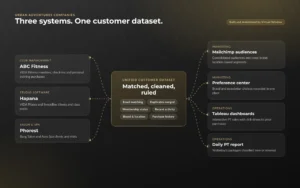
We connect your reporting into a single source of truth so every decision starts with trusted data instead of competing spreadsheets.






Intelligence In Action
Good reporting should change what you do on Monday.
See how we’ve helped organizations replace manual reports with dashboards their teams actually use.
Stop Guessing. Start Seeing.
Let’s build reporting that gives your team the confidence to act.